Agent observability + team memory

Know exactly why
your agents failed.

Trace every LLM call, tool call, cost spike, error, and decision path, then turn finished sessions into searchable team memory.

Tracea - Datadog for AI agents - traces, RCA, and team memory | Product Hunt
tracea.dev
Tracea dashboard
Total Cost
$221.46
83 sessions tracked
Issue Rate
44.0%
22 sessions flagged
9+
Agent integrations
100%
Data ownership
$0
Per seat / per event
Brain
Session memory
dashboard
sessions
live
brain
Tracea Dashboard Tracea Sessions Tracea Live Tracea Issues
Why tracea

Your agent data doesn't belong on someone else's server.

Most observability tools are cloud SaaS — your sessions, costs, and errors transit their infrastructure. Tracea runs entirely on yours.

Zero vendor lock-in. No per-event pricing. No black-box rules you can't inspect or version-control.

SaaS
tracea
Data stays on your server
Works with any framework
Inspectable detection rules
Free & open source
Slack + webhook alerts
AI-powered RCA (local)
Features

Trace what happened. Remember what mattered.

01
Session Tracking
Trace every LLM call, tool execution, error, and lifecycle event via transport-level interception — no wrappers or SDKs required.
02
Real-time Dashboard
Cost trends, token usage, duration distribution, session health, and agent breakdowns — all rendered locally in a React dashboard.
03
Issue Detection
YAML-configurable rules for tool errors, high cost, rate limits, infinite loops, and empty responses. Hot-reload on save — no restart.
04
AI-Powered RCA
Root cause analysis via OpenAI, Anthropic, or Ollama. Run it fully on-prem with Ollama — no data ever leaves your network.
05
Alert Routing
Route issues to Slack or any HTTP webhook. Per-destination rate limiting, deduplication in a 60s window, and exponential backoff retries.
06
Tracea Brain
Completed sessions become durable knowledge: workflows, fixes, codebase notes, recurring failures, and decisions your team should not rediscover.
Alert Routing

Get notified the moment something goes wrong.

Route issues to Slack, email, or any HTTP webhook. Tracea catches behavioral failures your logs never will.

Slack #agent-alerts
T
tracea 11:42 AM
🚨 Issue Detected — tool_error
Agent called process_refund but the tool returned an unhandled exception.
Agentbilling-agent
Sessionsess-a3f9c
Severityhigh
T
tracea 11:58 AM
⚠️ Issue Detected — high_cost
Session exceeded cost threshold — $4.21 in a single run.
Agentresearch-agent
Severitymedium
Email
Fromalerts@tracea.local
Toteam@yourcompany.com
Re[tracea] Infinite loop detected in ops-agent

Hi team,

Tracea detected an infinite_loop pattern in ops-agent — the same tool was called 14 times in a single session without a terminal state.

ISSUE TYPEinfinite_loop
SESSIONsess-bb2f1a
TOOL CALLS14× check_status
COST$1.87
DURATION18m 43s

Review the full session in your Tracea dashboard.

Webhook POST
{
  "type": "issue.detected",
  "severity": "high",
  "issue_type": "rate_limit",
  "agent_id": "code-agent",
  "session_id": "sess-7c3d9e",
  "message": "429 rate limit hit on
    gpt-4o — 3 retries failed",
  "model": "gpt-4o",
  "tokens_used": 84210,
  "cost_usd": 0.9824,
  "detected_at": "2026-04-25T11:42:03Z",
  "dashboard_url": "http://localhost:5173
    /issues/iss-4f2b"
}
200 OK · delivered in 142ms
Detects tool_error high_cost infinite_loop rate_limit task_failure empty_response high_latency
Integrations

Works with every major agent platform.

Claude Code
Native hooks
Gemini CLI
Native hooks
Kimi CLI
Native hooks
OpenCode
Native hooks
OpenClaw
Native hooks
Python SDK
Native
Cursor
MCP
Cline
MCP
Zed
MCP
Quickstart

Up and running in two minutes.

Docker handles everything. One command deploys the backend, dashboard, and database.

1
Clone and deploy
Run docker-compose up --build — server on :8080, dashboard on :5173.
2
Connect your agent
Add the hook script to Claude Code, Gemini CLI, or install the Python SDK. All LLM calls are auto-captured.
3
Open the dashboard
Paste your API key at localhost:5173 and watch sessions appear in real time.
4
Configure detection rules
Edit detection_rules.yaml — changes hot-reload without restarting the server.
docker
python sdk
curl
# Clone the repo
git clone https://github.com/darshannere/tracea.git
cd tracea

# Start everything
docker-compose up --build

# Server:    http://localhost:8080
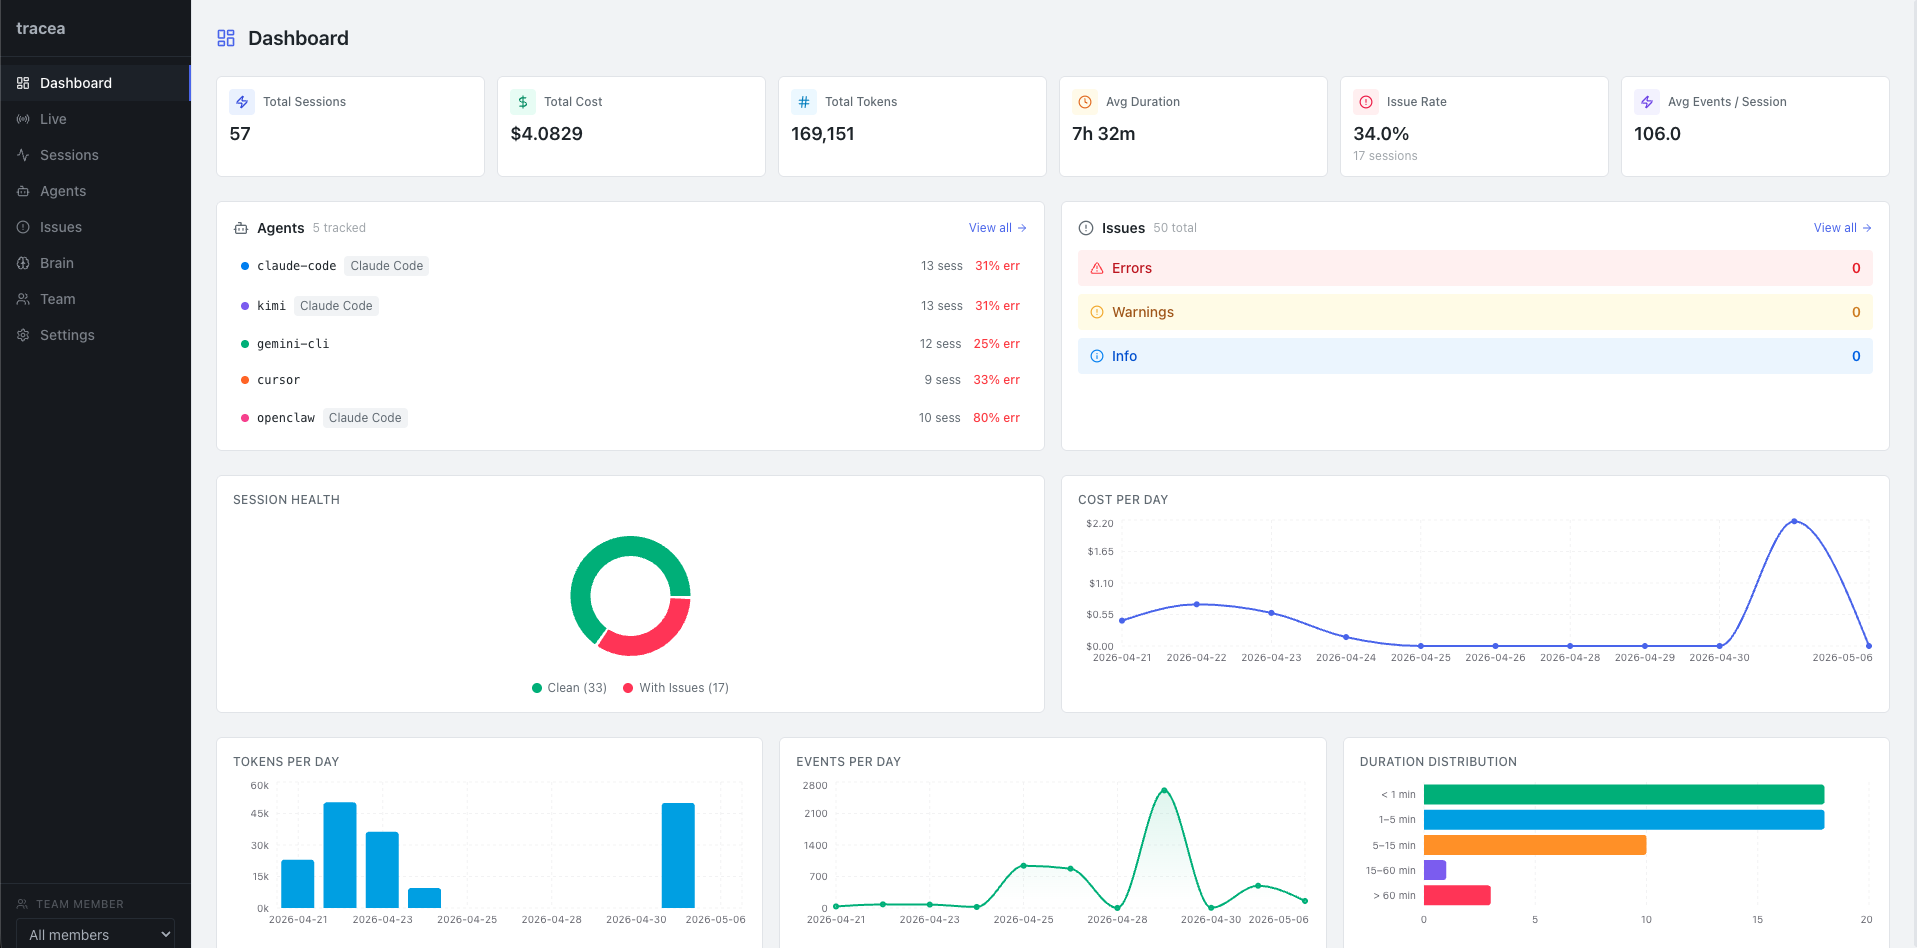
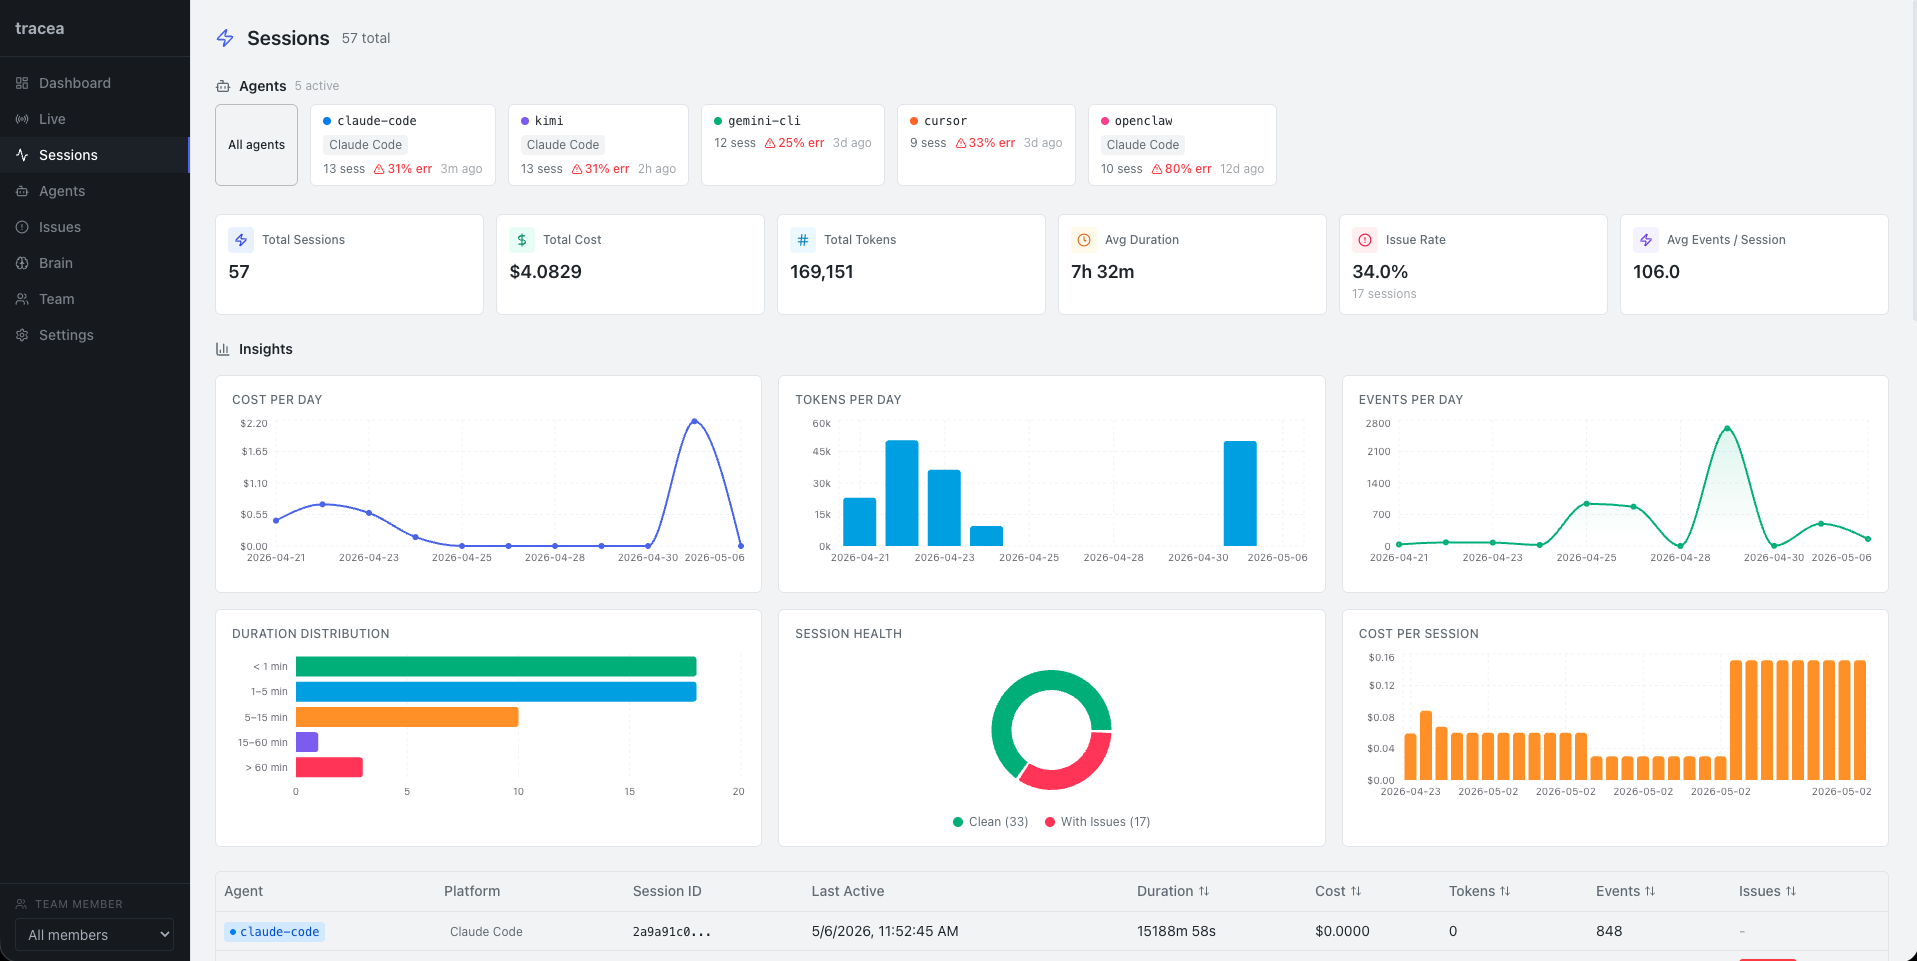
# Dashboard: http://localhost:5173
# API key:   ./data/api_key.txt
from tracea.sdk import TracingClient

# Patch transport — captures all LLM calls
client = TracingClient(
    url="http://localhost:8080",
    api_key="your-api-key",
    agent_id="my-agent",
)
client.install()

# Use OpenAI / Anthropic as normal
import openai
response = openai.chat.completions.create(...)
# → Auto-traced in tracea
API_KEY=$(cat data/api_key.txt)

curl -X POST http://localhost:8080/api/v1/events \
  -H "Authorization: Bearer $API_KEY" \
  -H "Content-Type: application/json" \
  -d '{
    "events": [{
      "event_id": "evt-001",
      "session_id": "sess-001",
      "agent_id": "my-agent",
      "type": "chat.completion",
      "provider": "openai",
      "model": "gpt-4o",
      "tokens_used": {"total": 512},
      "cost_usd": 0.003
    }]
  }'

Start tracing your agents today.

Run it locally, connect your agents, and start turning agent sessions into timelines, alerts, RCA, and team memory.